How to Read Your SCE Net-Metering Agreement Electricity Bill
Once you have a solar power system installed at your residence, the format of your electricity bill will change. During the installation process the solar contractor will send in a "net-metering agreement" application to your electric company. Once this agreement is signed off, your bill will now reflect this new year long net-metering contract. The Southern California Edison Net-Metering bill is explained below. For an explanation on a Southern California Edison "pre-solar" bill, and how to read it, see our SCE bill explanation page.
Edison Net Metering Bill - Page 1
Page one of Southern California Edison's Net metering agreement bill is shown and explained below.
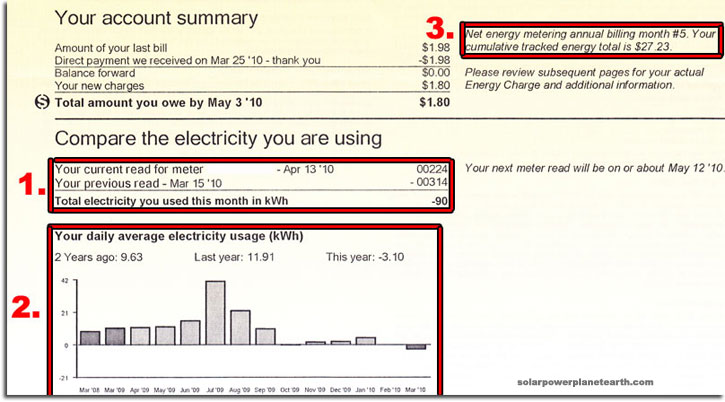
1) Electricity You Have Used This Month
Line one of this section shows what number was read on your meter this month. Line two shows what number was read the previous month. The third line shows line two subtracted from line one, which gives your total energy use for this month, in kilo-watt-hours (kWh). This number will be positive if you used more than your solar power system produced, or negative, if your solar power system produced more than you used. See our How to Read an Electric Meter to better understand how the power company gets your numbers.
2) Your Daily Average Electricity Usage
This section is not used to calculate your bill, but to give you a look at your historical energy use over the past year. This allows you to see how your energy use varies from month to month, and is a good way to keep tract of the difference your solar power system makes when you first install it. The example above shows that in March of the previous year, when there was no solar system, this person used 11.91kWh per day of electricity. This year however, the persons average daily electricity use was -3.10kWh with the solar system contribution. This negative number means that they were producing 3kWh more per day than they were consuming!
3) Cumulative Tracked Energy Total (CTET)
This section tells you what month you are currently in, within your "net-metered year." More importantly, it shows what your cumulative tracked energy total is. This number changes from month to month depending on if you produce more than you use or your use more than you produce. This is shown and explained further in the Edison Bill Page 4 section below.
Edison Net Metering Bill - Page 3
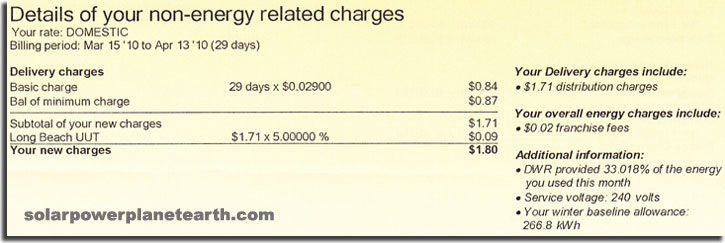
This page shows all "non-energy related" charges. This is the absolute minimum your bill can be each month if you were to never use more power than you produce. Non-Energy related charges are those associated with anything other than your actual energy consumption, such as distribution charges. Remember, in a grid-tied solar power system, you are still using power from the grid when you are not producing as much power as you are using, especially at night when your system is off. This minimum monthly fee is essentially for being connected to the grid and allowing your solar system to interact with it.
Edison Net Metering Bill - Page 4
This part of your net metered bill has two important sections. They are described below.
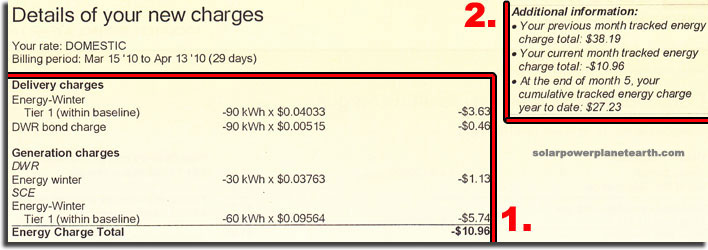
1) Your New Charges
This section is identical to your regular (pre-solar) edison bill, with the exception of potentially showing negative numbers if you produce more power than you used that month. This is reflected in the example above.
2) Tally of Your Tracked Energy Charge, Year (net-metered) to Date
So that you know exactly how your bill is adding up (or declining) month to month, this section makes it easy to see how your fairing. The first line shows what your tally was as of last month. The second line is what you earned or owe for the current month, which is added (or subtracted) to the first line. The product of this addition (or subtraction) gives you your current tally for this month and is shown in line three. This amount in line three is what you would have to pay (or what you are owed if you produced more power than you used) if your net metered year ended this month.
In the example above, line one shows the previous month's tracked energy total to be $38.19. Line two shows that you produced more electricity than you used, by an amount of $10.96. Line three shows that your tracked running total is now $27.23, which is last month's running total, $38.19, minus the amount of excess you produced this month, $10.96.